Excel bike sales project
Purpose
To help the bike selling company gather insights from data and make meaningful decisions that can drive in more customers and increase profit.
Tool used
Excel: Data cleaning and visualisation
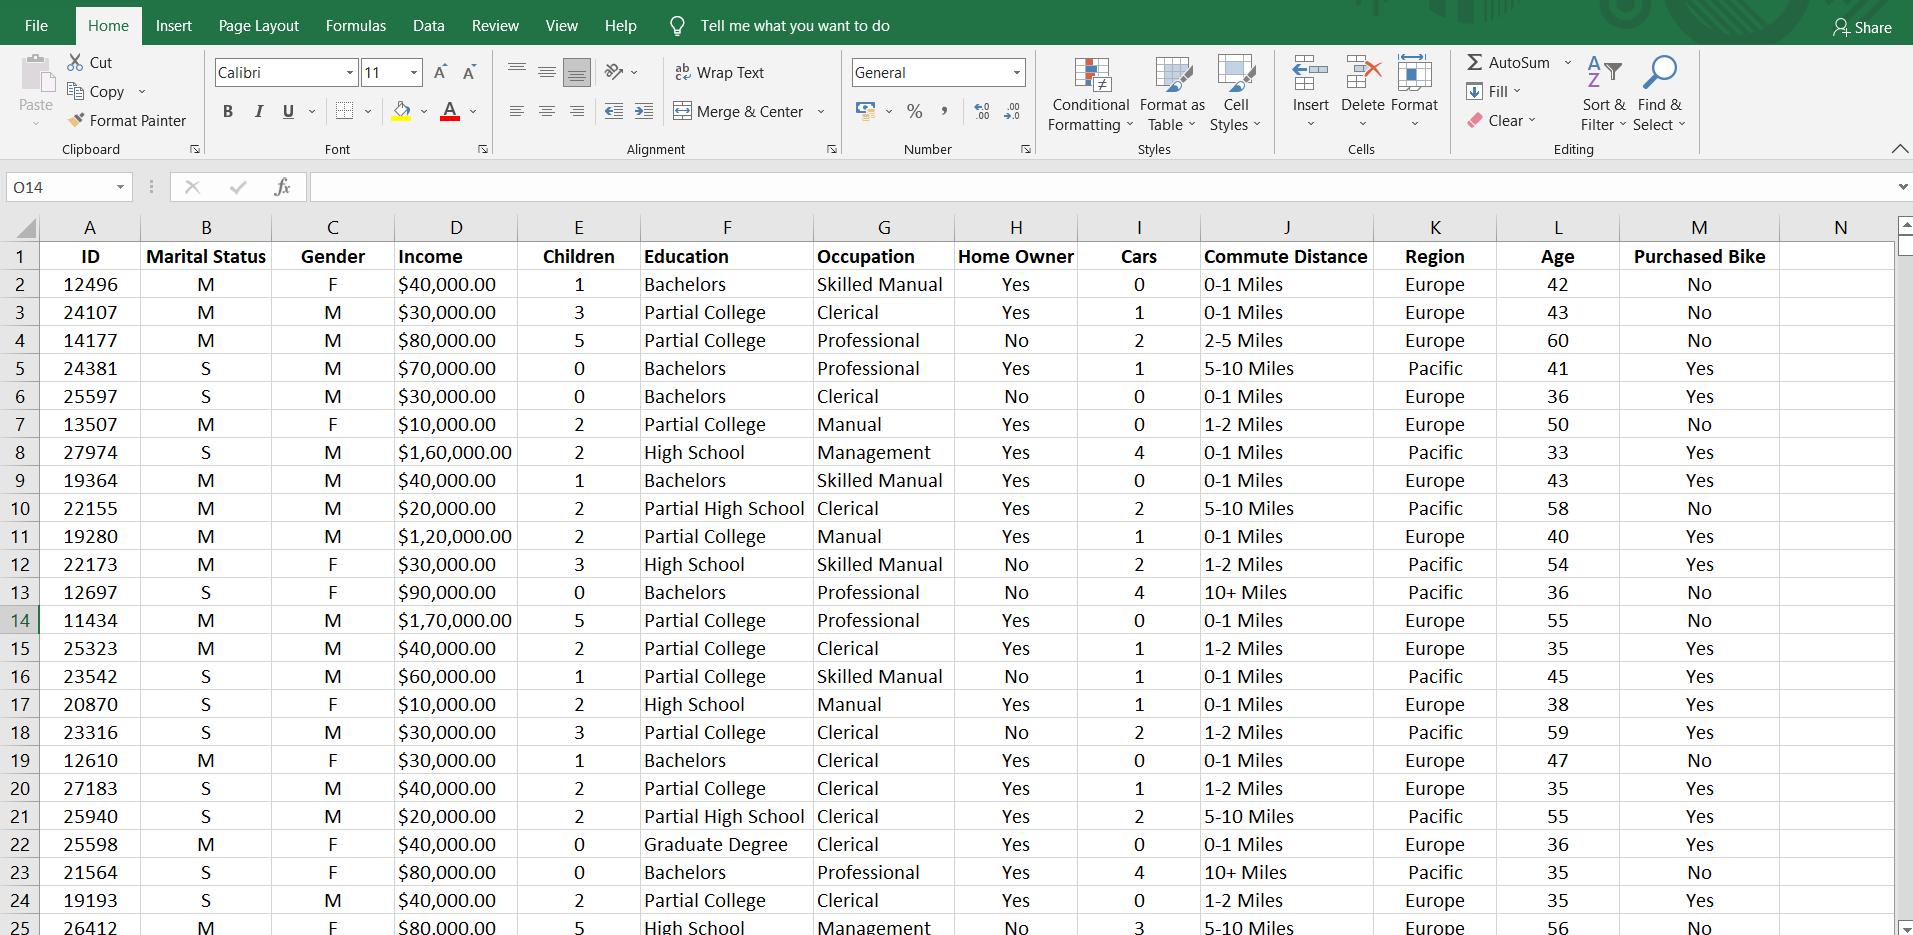
Raw data
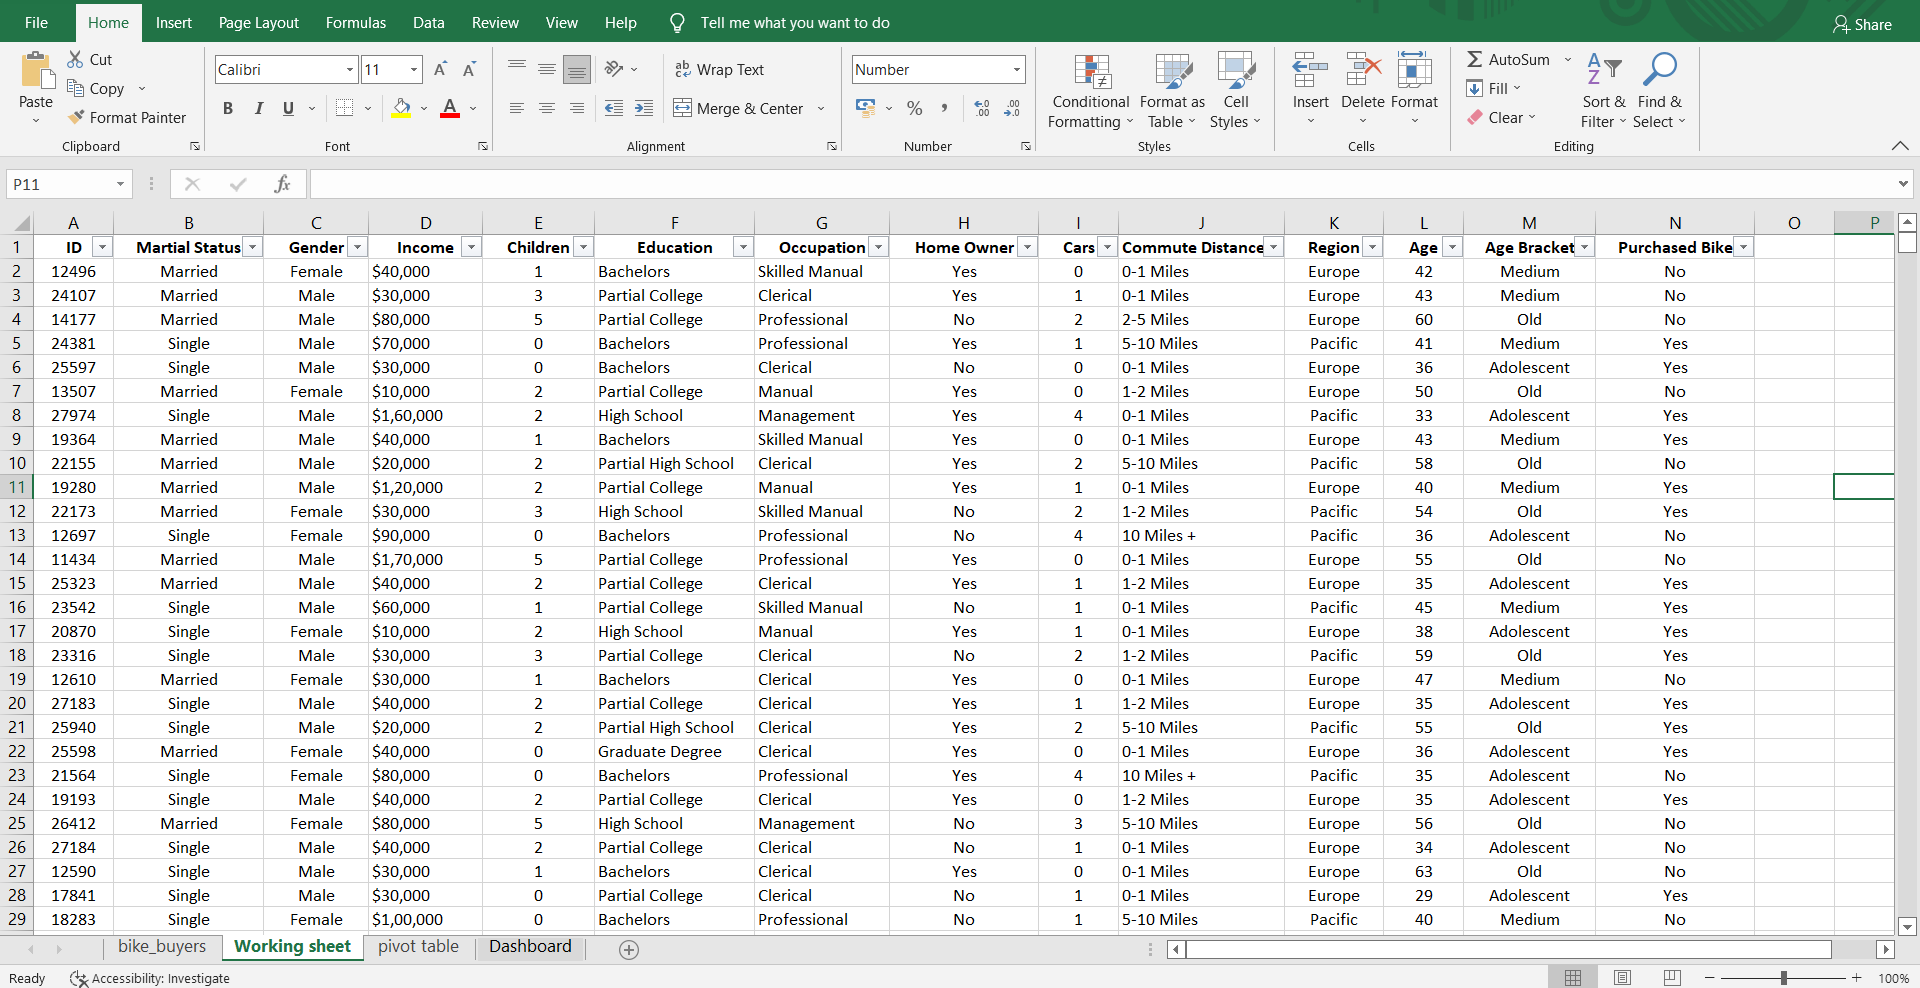
Cleaned data
- Changed martial status from 'M' to 'married' and 'S' to 'single' for better understanding. - Created age group to find out bike sales according to age group in analysis. - Dealt with duplicate values.
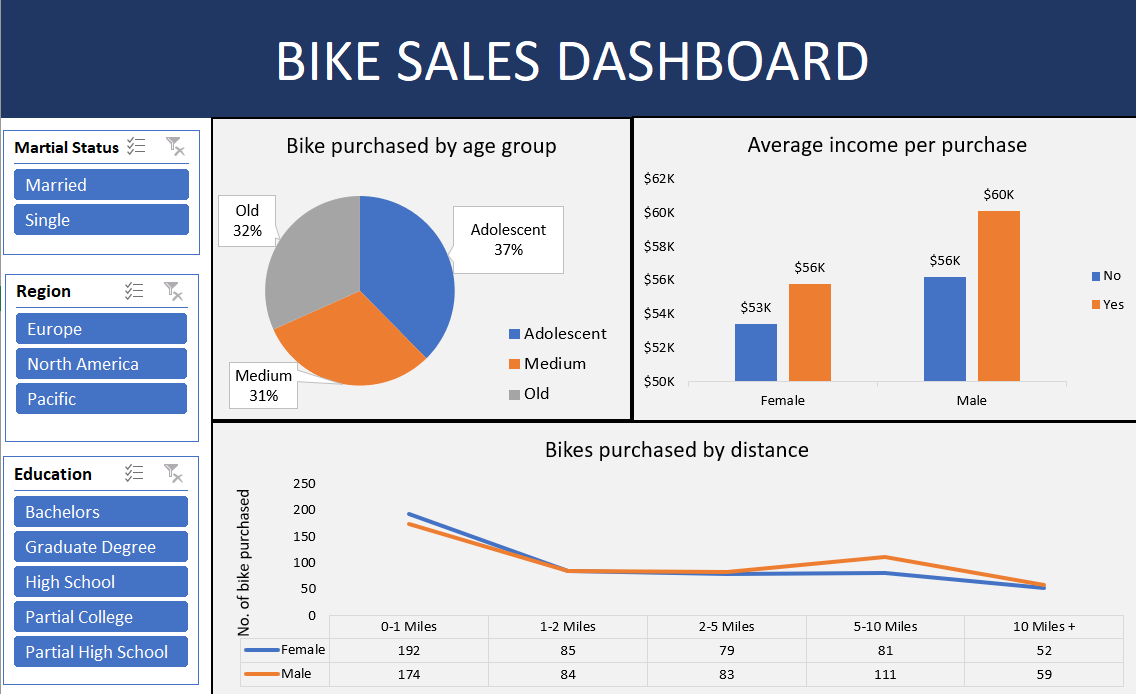
Final Dashboard picture
- Made pie chart to understand bike sales among different age group. - Made clustured column chart to see average income by bike purchased and gender. - Made Line chart to know the sales of bikes according to distance.
Findings
This interactive dashboard prepared in Excel represents customers from different backgrounds and can be filtered by regions and marital status. The dashboard shows customers from different age groups, averge income of customers and educational backgrounds all of which can be very useful to prepare customised marketing and promotional strategy to drive in more profit.
view file in github