Global superstore
Purpose
To find out different insights from the sales of products being sold all over the world, so that profit can be increased further.
Tools used
MS SQL server: As database to connect with power biPower bi: For data analysing, data cleaning, data modeling and data visualising
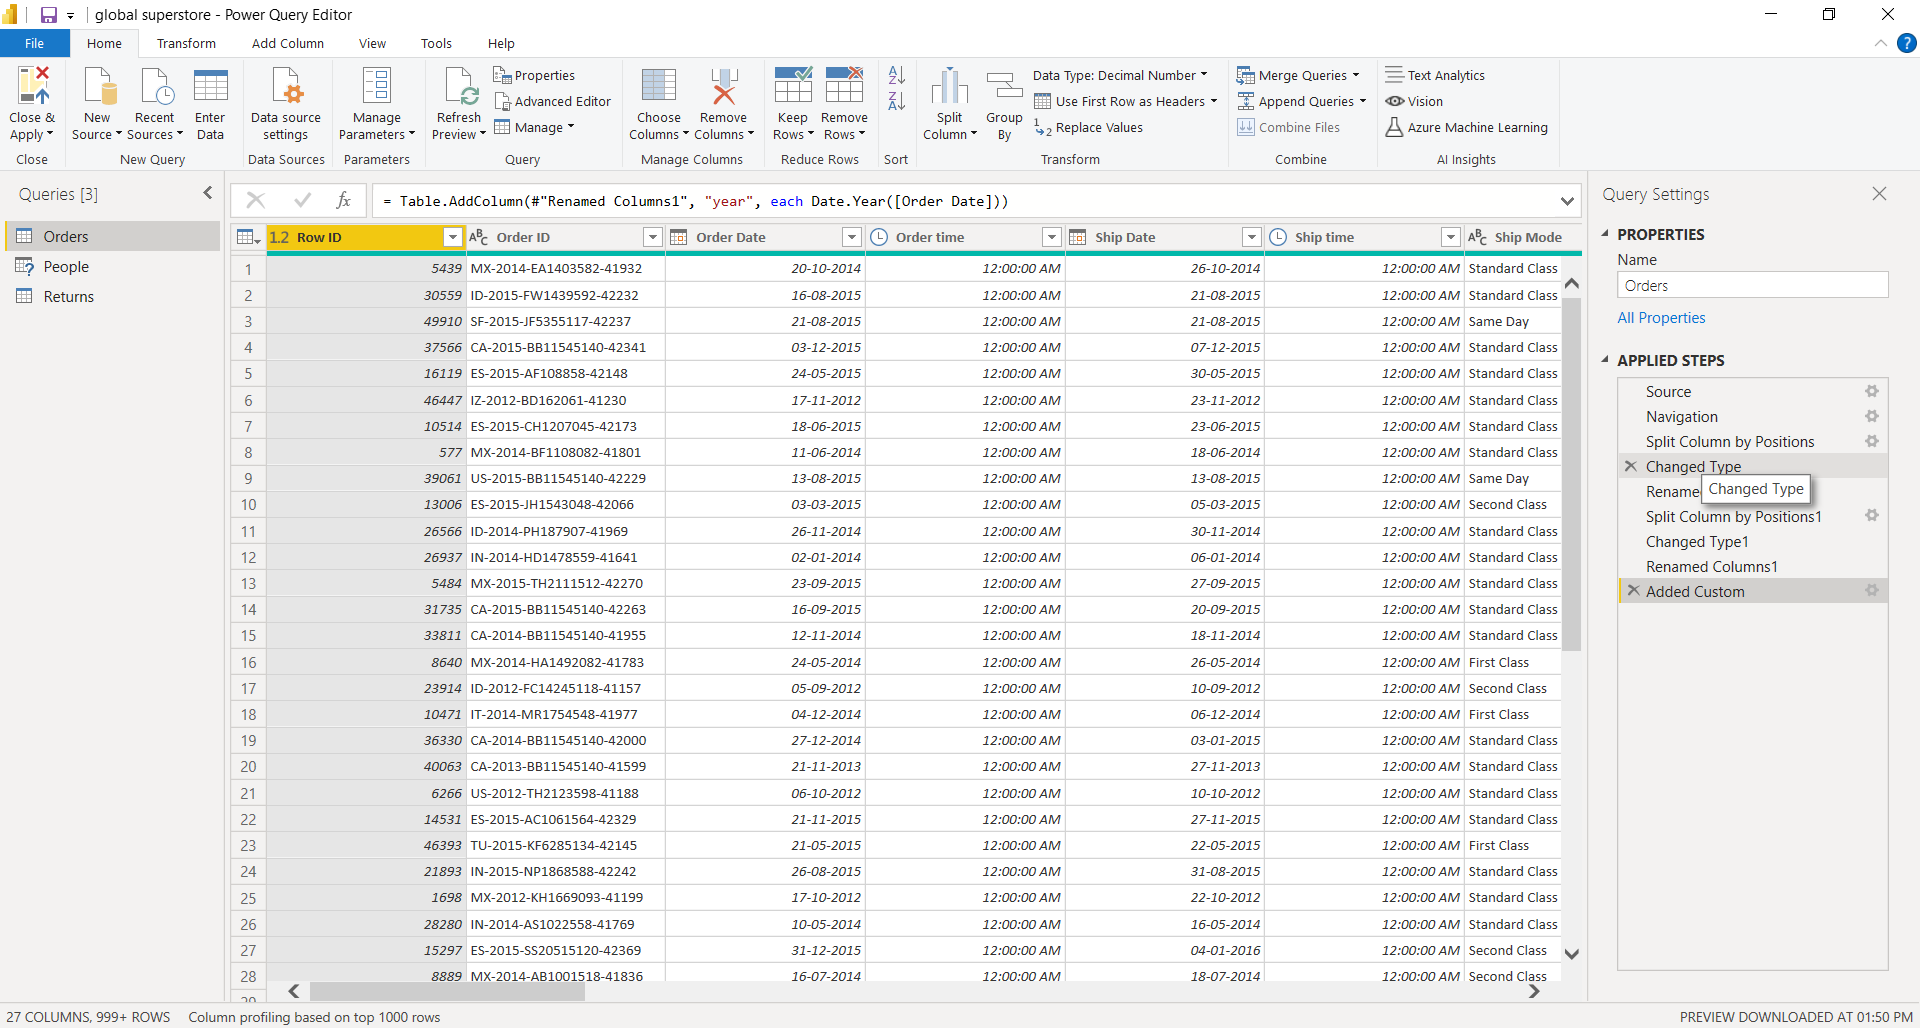
Analysing and cleaning the data in power bi query editor - dax
- Analysed tables and cleaned the data in power query editor. - Put columns heading names as person and region in people table in which headings were blank. - Removed the dollar sign in front of sales and profit column's values to analyze and visualize the data perfeclty. - Split the ship-date and order-date columns to ship date, ship time and order date, order time columns for better understanding.
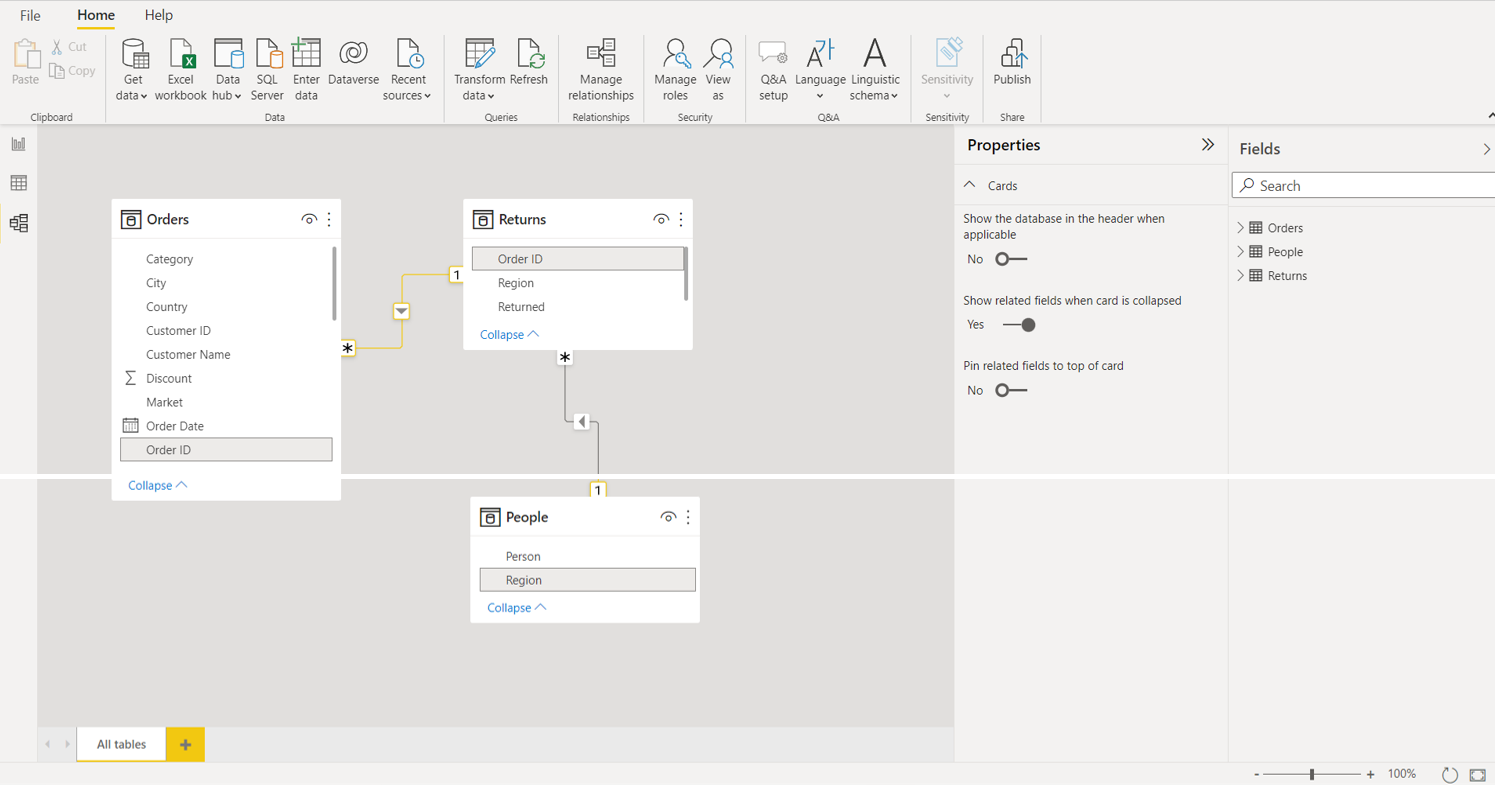
Data modeling in tableau
Modeled the data by creating the relationship among different tables.
Final Dashboard picture
- Found out top 5 products by profit and loss in horizontal bar chart. - Live data with filter options according to year. - Live total sales, total order and total orders returned KPIs. - Top 5 customer name by profit in column chart
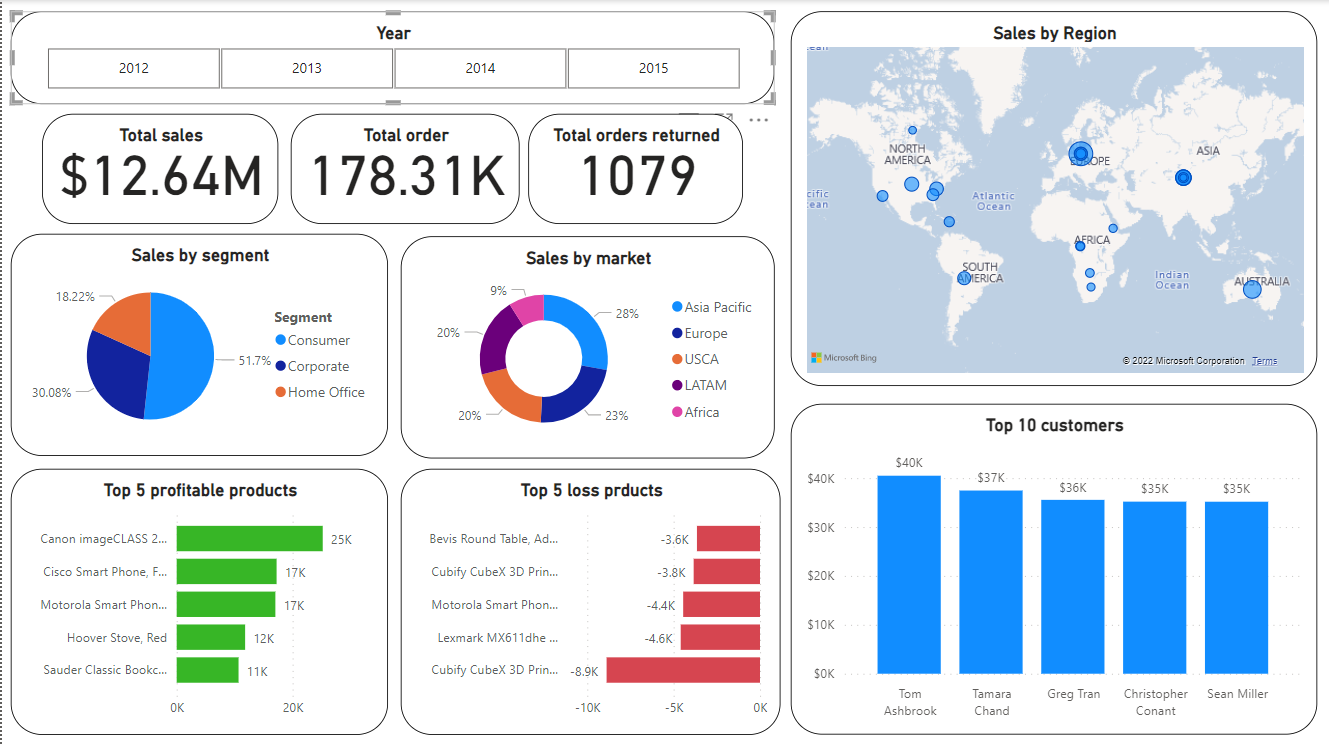
Findings
- canon imageClass 2200 advanced copier found out to be most profitable product while cubify cubex 3d printer least profitable. - Regions that drive in more revenue should be kept in consideration while building marketing strategies. - Yearly results can also be comapred in order to find seasonal trends. - Implement better customer support strategies for exisiting and new joined customers for better customer retention rate.